Benchmarks:
Fact, Fiction, or Fantasy
How
to make a 166 MHz Pentium perform like a 300 MHz Pentium II
and visa versa
By
Robert R. Collins
 Recently, I met
with someone who has made a career benchmarking computer
products. In fact, he found the business so lucrative he quit his
day job to capitalize on the benchmarking business. Over dinner,
he said, "Tell me what results you want, and I'll choose the
benchmark to give you those results." This didn't surprise
me, as I've been involved with benchmarking throughout my career.
However, ordinary consumers might be surprised by his comment --
especially if they've ever bought a computer product because of
published benchmark results.
Last year, the editors at a popular
computer magazine bemoaned the task of benchmarking an AMD
K6-based computer. They complained that the comparison between
the AMD-based PC and an Intel Pentium MMX-based PC they
previously tested couldn't be fair because the AMD-based system
had a higher performance disk subsystem.
At the time of the AMD test, the Seagate
Cheetah Ultra-Wide SCSI hard drive was new to the market; it
wasn't even available for beta testing when the Intel computer
had been tested. The Cheetah was the state-of-the-art in disk
performance. At the time of the Intel test, however,
state-of-the-art was the Seagate Barracuda 4LP Ultra-Wide SCSI
hard drive. Both AMD and Intel were guilty of stacking the deck
in their favor by configuring a benchmark computer with the
highest performance peripherals that were available on the
market. Therefore, the magazine's complaints seemed disingenuous.
There's nothing new about vendors loading a
computer with higher-performance peripherals for benchmarking
purposes. We did it when I worked at Acer; Intel did it for the
Pentium MMX tests. So why would the magazine editors complain
when AMD did the same thing? I suppose if they really were
concerned with this problem, the editors could have put the
Cheetah in the Intel computer or the Barracuda 4LP in the AMD
system, and rerun the tests. Instead, it was easier to complain
about the inherent inequity in the test than try to do something
about it. The end result is that the article implied AMD had been
somewhat deceptive.
Instances of computer manufacturers
submitting computers with the highest performance peripherals
available is common in the benchmarking industry. Vendors know
that high-performance peripherals can hide a multitude of bad
designs. Thus, benchmark results don't end up reflecting a good
computer design -- they end up reflecting how well the various
components work within the computer system.
In general, I've found there are three
basic types of benchmarks:
- Those that attempt to gauge overall
system performance.
- Those that attempt to measure specific
performance, such as raw compute power or bandwidth of
specific subsystems.
- Those that are only intended for
marketing purposes or to mislead and deceive.
Benchmark suites have been developed to
serve the needs of business, the most popular being BAPCO's
Sysmark (http://www.bapco.com/)
and Ziff-Davis' Winstone (http://www.zdbop.com/).
Both Sysmark and Winstone attempt to give you a measurement of
overall system performance. Raw computing power only plays a
minor role. Overall throughput is the metric of choice.
Some benchmarks attempt to measure specific
performance, like microprocessor and disk subsystems. WinBench
(also at http://www.zdbop.com/)
and SPEC (http://www.spec.org/)
are the two most popular benchmarks in this category. WinBench
uses a technique called a "playback" test, which uses
logs of system calls made during specific application activities
(graphics calls or disk usage, for example), then plays them back
in isolation. WinBench measures each subsystem of the computer:
disk, CD-ROM, CPU, memory, and graphics. SPEC is intended as a
measurement of raw CPU integer or floating-point performance
(SpecINT95 and SpecFP95).
Benchmarks can also be devised for
marketing purposes, and their published results should be
carefully weighed. Intel's ICOMP benchmark (Version 1.0), for
instance, is an example of a benchmark program developed by a
microprocessor manufacturer for measuring microprocessor
performance. ICOMP 1.0 was a proprietary benchmark, unique to
Intel. Intel didn't publish the formula for ICOMP 1.0, nor did it
allow anyone to license the program. Therefore, the results
couldn't be independently verified. Thankfully, Intel has
abandoned ICOMP 1.0, replacing it with ICOMP 2.0. The formula for
ICOMP 2.0 is published at http://www.intel.com/procs/perf/icomp/faxback/ICOMP.HTM, making it an open standard that can be
independently verified.
In short, vendors know that peripherals
make more difference in benchmark results than any motherboard
design or CPU choice. Differences in motherboard design would
never account for more than one or two percentage points of
benchmark results. Likewise, whether you choose an AMD, Cyrix,
Intel, or IDT 586-class CPU will not make much of a difference in
most benchmark results either. Therefore, unless you have
specific computing needs, your money would be more wisely spent
by purchasing a slower, cheaper motherboard and CPU, and spending
the money you've saved on higher-performance peripherals.
The Challenge
To prove my point, I will make a
Pentium running at 166 MHz appear to outperform a Pentium
II running at 300 MHz. How will I do this? Simple. I'll
start with a basic 166-MHz computer that is typical of
home systems. From that point, I'll upgrade the graphics
and disk subsystems. With these two minor changes, I can
achieve higher (benchmarked) performance than the 300-MHz
Pentium II, running with the same base components as the
Pentium 166.
This demonstration will underscore
some important principles:
- Beware of benchmark results.
Always scrutinize what peripherals are being
used. If you don't recognize the peripherals, you
might as well consider the benchmark results
meaningless.
- Beware of benchmark
comparisons. If the motherboard, memory, and
peripherals aren't identical, the benchmark
comparison is meaningless. Even when the
peripherals are the same, the results can
sometimes be meaningless. For example, in one
test, the graphics card may have been set for
1024x768x(eight-bit) colors, while another test
may have the graphics card set for
1024x768x(24-bit) colors. The latter test must
write three times as much data to the video card.
Therefore, it will drag down the benchmark
results.
- The proper graphics card and
disk subsystem can substantially increase
performance. You don't need a 300-MHz Pentium II
to play Quake (in spite of what the
Bunny-Geeks tell you). You only need to upgrade
the components of your computer to achieve
300-MHz-like performance.
- Choosing the highest priced
components doesn't always produce the highest
performance.
- It's easy to cripple the
performance of a 300-MHz computer -- simply
choose the wrong peripheral components.
For the purposes of these tests,
I've selected benchmark suites from both main categories
of benchmarking. Winstone and Sysmark are representative
benchmark suites to gauge overall system performance.
Winstone is published by Ziff-Davis. A consortium of
computer and software manufacturers (of which Intel is a
member) publishes BAPCO's Sysmark. (BAPCO's office, in
fact, is located inside Intel's corporate headquarters.)
In general, I found the BAPCO's methodology more
scientific than Winstone's. While Winstone allows testers
to set a dizzying array of configuration options, BAPCO
does not. The infinite variability of Winstone test
configurations makes it more prone to manipulation for
benchmark brinkmanship purposes. Therefore, it is
unfortunate that Intel's involvement in BAPCO has meant
the Sysmark suite has a low acceptance level in the
computer industry.
For low-level benchmarks, I've
chosen WinBench and SpecINT. WinBench attempts to measure
all of the computer subsystems, while SpecINT only
measures microprocessor integer performance.
I set up two separate computer
systems as identically as possible. Table 1 describes both systems and my rationale for
each choice. The computer systems in this table are
considered the control (constants) of my tests. These
components will not change from configuration to
configuration, or from test to test. It's important in
benchmarking to establish a control set. Once benchmark
results are established for the control, the variable
components can be changed to demonstrate their net
effect.
As my variable components, I've
chosen two different subsystems. I'm going to change the
video and disk subsystem independently to demonstrate
their influence on the benchmark results. Tables 2 and 3 list both
subsystems and the components I've chosen for my test
purposes.
|
Table
1 - Basic Computer Configurations
| Component |
166 MHz |
300 MHz |
Methodology |
| Motherboard |
Tyan Tomcat IV S1564D |
Tyan Tahoe 2 S1682D |
Both motherboards are a dual CPU
design. Only one CPU installed. Choosing the same
manufacturer ensures similar design methodology.
Tyan S1564 uses the Intel 82430 HX chipset. The
HX chipset is the only Intel chipset for Pentium
processors which is capable of caching more than
64 MB of memory. |
| Microprocessor |
Intel Pentium (P54c) 166 latest
stepping |
Intel Pentium II 300 latest stepping |
P54c is representative of what Joe
Consumer actually has at home. The Pentium II 300
MHz is representative of what Intel would like
Joe Consumer to believe he needs at home. |
| Memory |
64 MB EDO |
64 MB EDO |
Same manufacturer and packaging. |
| Cache |
512 KB L2 |
512 KB L2 |
Equal cache sizes. |
| Video |
1024x768x256 colors |
1024x768x256 colors |
Lowest resolution possible for use
with benchmark programs. Should also produce
highest possible performance for benchmark
results. |
| Operating System |
Windows NT 4.0, Service Pack 3 |
Windows NT 4.0, Service Pack 3 |
To heck with Windows 95, it's a
nightmare. Windows NT is much easier to switch
around components without worrying what else
Windows 95 and the plug-and-pray garbage in
Windows 95 may have installed. Service Pack 3
ensures the latest patches for Windows NT 4.0.
Service pack 3 also enhanced video performance. |
Table 2
- Video Subsystems
| Component |
Memory |
Bus |
Methodology |
| SIIG Master ISA |
1 MB DRAM |
ISA |
Symbolic of what Joe Consumer may
have purchased in his AOL-equipped Pentium 166. |
| Matrox Millenium |
4 MB DRAM |
PCI |
Considered state-of-the-art for 2D
Graphics |
| IMS Twin Turbo |
8 MB VRAM |
PCI |
Logic should indicate that more is
better, and VRAM is better than DRAM. Certainly
this card costs $100 more than the Matrox
Millenium does. |
Table
3 - Disk Subsystems
| Disk |
CD-ROM |
Controller |
Methodology |
| Fujitsu M1624 TAU |
Sanyo CRD 168P 8x Speed |
On-board IDE |
Joe's typical configuration. In the
BIOS setup, I throttled the Fujitsu drive down to
Mode-2 performance. I felt Mode-2 was typical
performance in the average computer 18 months ago
when 166 MHz was en vogue. |
| Seagate ST 34572W Barracuda 4LP 7200
RPMs, 4.5 GB Ultra-Wide SCSI |
Teac CD-516S 16x Speed |
Adaptec 2940 UW |
The Seagate and Adaptec Controller
are capable of 40 MB/Second throughput. Actual
throughput is limited by the disk internal
transfer rate. However, this disk-controller
combination is very cost-effective for a high
performance disk subsystem. |
| Micropolis 4345 WAV 7200 RPMs,
4.5 GB Ultra-Wide SCSI |
Teac CD-516S 16x Speed |
Adaptec 2940 UW |
To make matters fair, the Micropolis
drive is tested against the Seagate Barracuda
4LP. Both drives are considered A/V ready. |
| Seagate ST 19101W Cheetah 9, 10000
RPMs, 9.1 GB, Ultra-Wide SCSI |
Pioneer DR-U24X 24x Speed |
Diamond Fireport 40 |
The Seagate Cheetah is considered
the pinnacle of performance. At 10000 RPMs, only
the IBM 9XL can match (and exceed) it's
performance. Instead of using the venerable
Adaptec 2940 UW, I've chosen the Diamond Fireport
40 SCSI controller. The Fireport controller uses
a faster SCSI chip, and costs one-half the price
of the Adaptec card. |
| IBM 9XL, 10000 RPMs, 9.1 GB,
Ultra-Wide SCSI |
Pioneer DR-U24X 24x Speed |
Diamond Fireport 40 |
This drive was released just before
I was completed with my research. As I found out,
this drive is the new the performance
king-of-the-hill. |
|
Problems at
Benchmark Central
Running benchmarks always seems to present
its share of problems. I found that some benchmarks are
temperamental. Winstone 97 can easily time out or even hang a
computer system. With Winstone 97, I discovered that the order in
which the benchmark software and the NT Service pack are
installed made a difference in function and performance. If the
Service Pack is installed before the benchmark software, then the
tests often time out. If the Service Pack is installed after the
benchmark software, then no such problems exist.
Winstone 97 also gave me problems with my
IMS Twin Turbo video card. In spite of numerous calls to the
manufacturer, I could never resolve these problems. Eventually I
gave up, and told the manufacturer that it would have to be
dropped from the test. It's too bad, because the IMS Twin Turbo
was a perfect example of "higher cost isn't always higher
performance." The Twin Turbo cost nearly double the price of
the Matrox Millennium, yet suffered from 30-percent lower
performance. This just shows that better peripherals don't always
come in more expensive packages.
The Pioneer 24x CD-ROM had its share of
problems. When running WinBench, the CD-ROM tests sometimes
failed. WinBench reported that the CD-ROM drive didn't contain a
disk, and suggested that I reinsert the disk before retrying the
test. I found that this problem was likely caused by the
high-speed drive being out of balance. Often times, when I
repositioned the CD-ROM drive, the problems would go away. I also
noticed that the performance of the CD-ROM drive was
inconsistent. Again, this was most likely caused by the drive
being out of balance and issuing multiple retries before
successfully reading the data on the CD-ROM.
Lastly, my Micropolis 4345 WAV drive blew a
head gasket before crossing the finish line. I was running my
last configuration on this drive when it quit working. The motor
would spin up, then spin down -- over and over. The hard drive
never booted again. Contacting the manufacturer for a replacement
wouldn't have helped: Micropolis is now out of business.
The Results
As I expected, benchmarks that
measured specific computer components were the most
reliable and gave the most consistent results. Such
benchmarks weren't dramatically affected by
high-performance video controllers and high-performance
disk subsystems. SpecINT95 gave consistent results
regardless of configuration changes. The Pentium 166
consistently scored between 3.53 and 3.55 SpecINT95
(base). The Pentium II 300 scored consistently at 8.99 to
9.00 SpecINT95. Because of their predicted consistency, I
have excluded their results from the remainder of this
discussion -- doing so would only become redundant.
The remainder of the results will
show the dramatic impact that enhanced peripherals can
have on overall system performance. Keep in mind that the
ultimate goal is to prove that a Pentium 166 can show
higher performance on systems benchmarks than a Pentium
II 300. Winstone and Sysmark are our systems-benchmark
measuring tools. Even though WinBench isn't a systems
benchmark, I've included selected WinBench results to
demonstrate the impact on the computer system of
enhancing the video and disk subsystems.
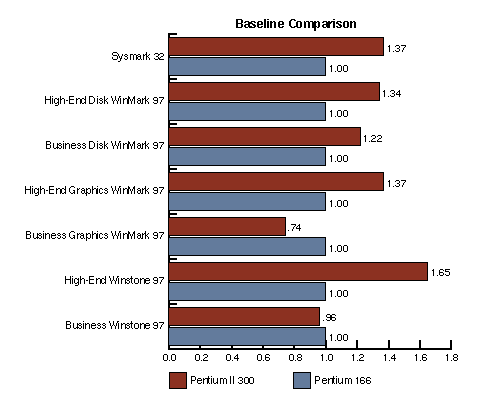
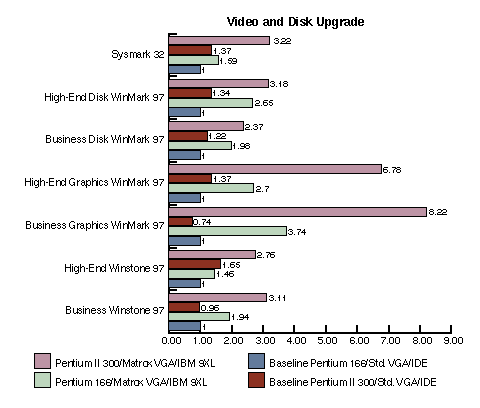
Figure 1 shows the baseline configuration for my
Pentium 166 and Pentium II 300 tests. The baseline
configuration for each computer consists of an IDE hard
drive, and standard VGA video controller. All of the
results have been normalized to this baseline
configuration. Hence, all results can be considered as
percentage differences between configurations.
Normalizing the results gives an easy-to-read visual
display, which shows how one configuration compares to
another. (If you're interested in the actual benchmark
results, they're available electronically in an Excel
spreadsheet; see "Resource Center," page 3. The
spreadsheet is also available at http://www.x86.org/ddj/Mar98/Benchmarks.xls.)
Some of the results may appear to
be anomalous. The Pentium II Graphics Winmark and
Business Winstone results show lower performance than the
baseline configuration. These results would tend to defy
logic. As a means to mitigate these anomalous results, I
ran each benchmark test three times, and reported the
highest results for any given run. This method guarantees
that the results aren't anomalous, but instead are
best-case representations of what was measured by the
benchmark programs.
As Figure 1 shows, the Pentium II
300 performs consistently better than the Pentium 166. To
show the performance benefits of the disk subsystem
enhancements, I've broken up the Pentium 166 and Pentium
II 300 results into two separate graphs. Both graphs
include the Pentium 166 and Pentium II 300 baseline
configuration. This inclusion was intended for
comparative purposes to demonstrate the enhancing effects
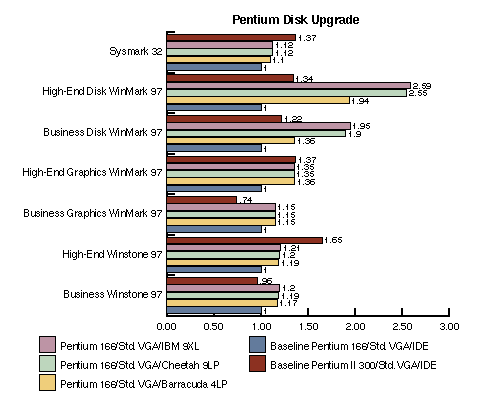
of higher-performance peripherals. Figure 2 shows
the benefits of enhancing the disk subsystem for our
Pentium 166. As this graph shows, the disk subsystem
enhancement influences overall system performance by
approximately 12 percent for Sysmark, and approximately
20 percent for Winstone. Interestingly, Sysmark and
Winstone didn't show much difference between the 7200-
and 10000-RPM SCSI drives, while the WinBench results
clearly showed the performance superiority of the
10000-RPM SCSI drives.
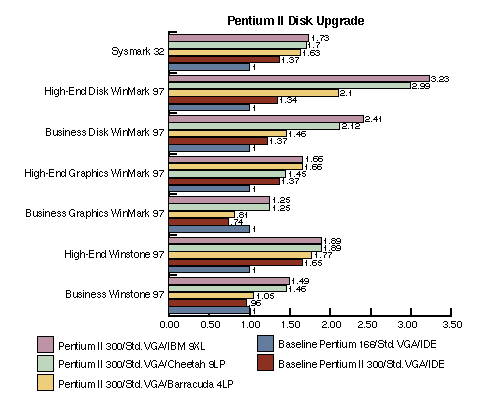
Similar results were seen on the
Pentium II 300 disk enhancements; see Figure 3. The Pentium II 300 results show little
effect of the 7200-RPM SCSI drives on Winstone, but
dramatic performance benefits for the 10000-RPM drives.
Sysmark seemed to show a more linear performance benefit
between the 7200- and 10000-RPM SCSI drives. The WinBench
results again show the performance superiority of the
10000-RPM SCSI drives. It's interesting that the Pentium
II 300 WinBench results clearly show the IBM 9XL having a
performance advantage over the Seagate Cheetah 9LP.
As remarkable as the
disk-performance benefits have been on overall system
performance, I still haven't achieved the goal of making
a Pentium 166 benchmark better than a Pentium II 300. To
achieve this goal, you need only look as far as the video
performance. Video performance alone was enough to fool
Business Winstone and Sysmark. But video performance
alone wasn't enough to fool the Highend Winstone
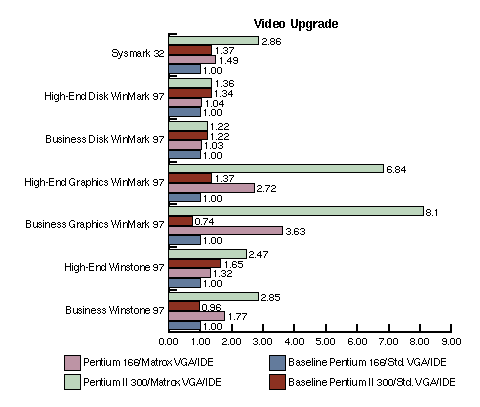
benchmark programs. Figure 4 shows
the results for the Pentium 166 and Pentium II 300. Using
the Matrox Millennium, Business Winstone showed a
whopping 81 percent performance improvement over the
baseline Pentium II 300 configuration. Sysmark was only
fooled into showing a 12 percent difference. Don't ignore
the WinBench graphics results. These results clearly show
the advantages of high-performance video controllers --
like the Matrox Millennium.
Lastly, Figure 5 shows
the net effect of enhancing the video subsystem with the
Matrox Millennium, and the disk subsystem with the
10000-RPM IBM 9XL SCSI hard drive. Like the video
enhancements, Sysmark and Business Winstone were fooled
into thinking the slower Pentium 166 gave better
performance than the stellar Pentium II 300 did. Figure 5
shows the Pentium 166 outperforming the Pentium II 300 by
22 percent on Sysmark, and by 98 percent on Business
Winstone. Highend Winstone was not fooled by any of my
tricks. The Highend Winstone results always showed
proportional performance increases that you would expect
to find between a 166-MHz and 300-MHz computer.
|
|
Conclusion
As I expected, it is easy to make a Pentium
166 appear to outperform a Pentium II 300. With a simple video
controller and a hard drive, I was able to make Business Winstone
97 show a Pentium 166 to have 98 percent better performance than
a 300-MHz Pentium II computer. This demonstrates that you
shouldn't always trust the benchmark results that you read in
computer magazines. Keep this in mind when reading benchmark
comparisons: Unless all of the computers are tested on equal
configurations, allowing only one variable to change (like the
motherboard or CPU), then the results might as well be
meaningless.
As I discovered, more isn't always better.
The higher-priced video controllers actually performed 30 percent
lower than the lower-priced Matrox Millennium. Conversely, the
$200 Matrox Millennium gave a bigger performance boost than the
$1000+ IBM 9XL SCSI hard drive. A small battle between SCSI
controllers found the Diamond Fireport outperformed the Adaptec
2940 UW at approximately one-half the price. Even though the 24x
CD-ROM gave good performance, I found it too unstable to be
trusted. Therefore, instead of upgrading my next computer to a
Pentium II, I think I'll upgrade to a 233-MHz AMD K6, add the
Matrox Millennium, and get the cheaper Diamond Fireport with
4.5-GB 10000-RPM SCSI hard drive. These enhancements will give me
all the performance I need -- and then some.
Back to Dr. Dobb's
Undocumented Corner home page
 Recently, I met
with someone who has made a career benchmarking computer
products. In fact, he found the business so lucrative he quit his
day job to capitalize on the benchmarking business. Over dinner,
he said, "Tell me what results you want, and I'll choose the
benchmark to give you those results." This didn't surprise
me, as I've been involved with benchmarking throughout my career.
However, ordinary consumers might be surprised by his comment --
especially if they've ever bought a computer product because of
published benchmark results.


